signal strength 4 of 5

According to the chart of H1, AUDUSD formed the Inverse Head and Shoulder pattern. The Head’s top is set at 0.6315 while the median line of the Neck is found at 0.6220/0.6291. The formation of the Inverse Head and Shoulder pattern evidently signals a reversal of the downward trend. In other words, in case the scenario comes true, the price of AUDUSD will go towards 0.6355
Veja também
- All
- Double Top
- Flag
- Head and Shoulders
- Pennant
- Rectangle
- Triangle
- Triple top
- All
- #AAPL
- #AMZN
- #Bitcoin
- #EBAY
- #FB
- #GOOG
- #INTC
- #KO
- #MA
- #MCD
- #MSFT
- #NTDOY
- #PEP
- #TSLA
- #TWTR
- AUDCAD
- AUDCHF
- AUDJPY
- AUDUSD
- EURCAD
- EURCHF
- EURGBP
- EURJPY
- EURNZD
- EURRUB
- EURUSD
- GBPAUD
- GBPCHF
- GBPJPY
- GBPUSD
- GOLD
- NZDCAD
- NZDCHF
- NZDJPY
- NZDUSD
- SILVER
- USDCAD
- USDCHF
- USDJPY
- USDRUB
- All
- M5
- M15
- M30
- H1
- D1
- All
- Buy
- Sale
- All
- 1
- 2
- 3
- 4
- 5

No gráfico do instrumento de negociação #Bitcoin M5, o padrão Topo triplo que sinaliza uma mudança de tendência se formou. É possível que após a formação do terceiro pico
Os intervalos M5 e M15 podem ter mais pontos de entrada falsos.
Open chart in a new window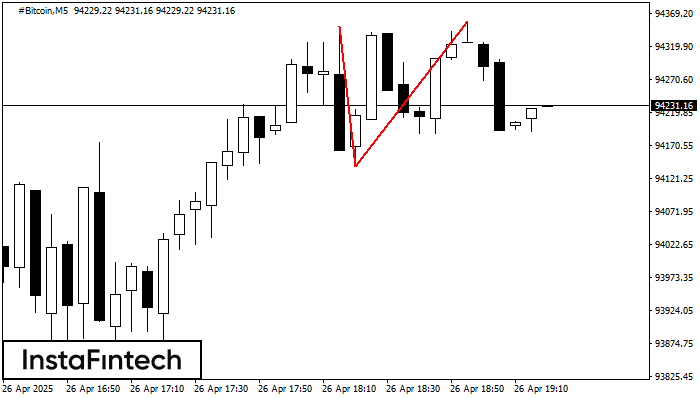
O padrão de reversão Topo duplo foi formado em #Bitcoin M5. Características: o limite superior 94348.84; o limite inferior 94140.31; a largura do padrão é de 21661 pontos. As operações
Os intervalos M5 e M15 podem ter mais pontos de entrada falsos.
Open chart in a new window
O padrão Fundo triplo foi formado no gráfico do instrumento de negociação #Bitcoin M15. O padrão sinaliza uma mudança na tendência de baixa para alta no caso de quebra
Os intervalos M5 e M15 podem ter mais pontos de entrada falsos.
Open chart in a new window