empty
11.10.2023 06:24 AM
Trading Signals for USD/JPY for October 11-12, 2023: buy above 148.85 (21 SMA - 7/8 Murray)

This image is no longer relevant

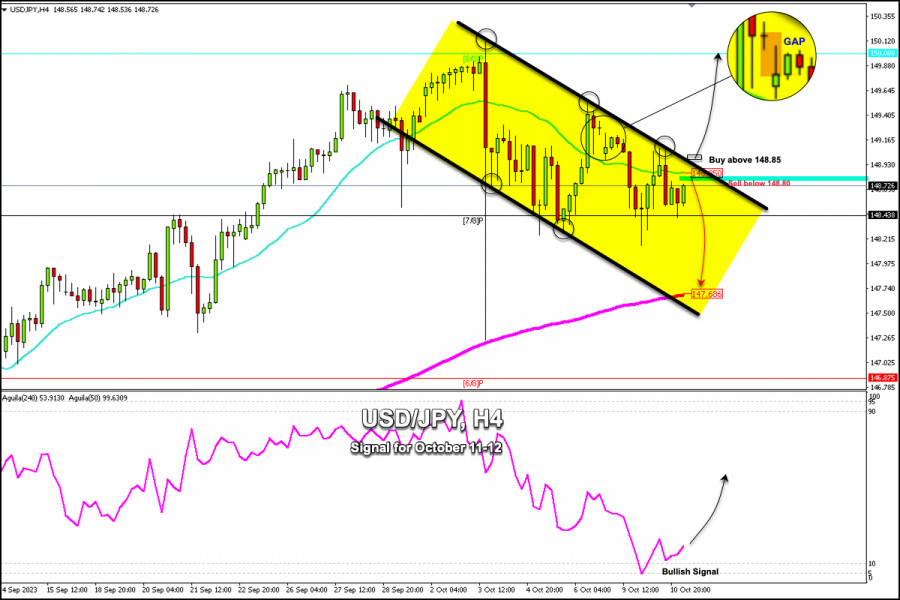
USD/JPY is trading around 148.72, below the 21 SMA, and above 7/8 Murray. On the H-4 chart, we can see that the instrument is within a downward trend channel formed since October 3, but it is showing oversold signs. It is likely that there will be a technical rebound in the coming days and USD/JPY could approach the psychological level of 150.00 (8/8 Murray).

At the opening of negotiations this week, the Japanese yen left a bearish GAP around 149.25. This GAP is likely to be covered in the coming days, only if the Japanese yen breaks the bearish trend channel sharply and consolidates above 148.90.

On the other hand, if the USD/JPY pair fails to overcome the 148.85 area, we could expect a fall and the price could reach the 200 EMA located at 147.68.

The Japanese yen has also been a refuge asset for many years in case of increased risk aversion. Therefore, if geopolitical problems persist, it is likely that the yen will continue to fall. The key will be to watch for it to trade below 149.00, then it could reach 147.68 (200 EMA) and even 6/8 of Murray at 146.87.

The eagle indicator is giving a positive signal which could favor an increase in USD/JPY and the instrument could reach 149.50 and 150.00. On the other hand, if the Japanese yen falls below 148.43 (7/8 Murray), it could be seen as a clear signal to sell with the target at 147.68 (200 EMA).

Dimitrios Zappas,
Especialista em análise na InstaForex
© 2007-2025
Selecionar intervalo de tempo
5
min
15
min
30
min
1
hora
4
horas
1
dia
1
s.
Ganhe com as variações das taxas das criptomoedas com a InstaForex.
Baixe o MetaTrader 4 e abra a sua primeira operação.
  • Grand Choice
    Contest by
    InstaForex
    InstaForex always strives to help you
    fulfill your biggest dreams.
    PARTICIPE DO CONCURSO

Recommended Stories

Sinais de negociação para o OURO (XAU/USD) para 14-17 de abril de 2024: venda abaixo de $3.224 (+1/8 Murray - SMA 21)

Nosso plano de negociação para as próximas horas é vender o ouro abaixo de 3.224, visando os alvos 3.203 e 3.156. Devemos estar atentos a qualquer recuperação técnica

Dimitrios Zappas 18:25 2025-04-14 UTC+2

Análise técnica do movimento intradiário do preço do paládio vs USD, segunda-feira, 24 de abril de 2025.

Com a formação de uma divergência no indicador Estocástico em relação ao movimento de preço do par XPD/USD no gráfico de 4 horas — somada ao surgimento de um padrão

Arief Makmur 15:41 2025-04-14 UTC+2

TAnálise técnica do movimento intradiário de preços do petróleo bruto, segunda-feira, 24 de abril de 2025.

No gráfico de 4 horas o Petróleo Bruto, podemos observar a formação de um padrão OCO Invertido (Cabeça & Ombro Invertido), além do Padrão Altista 123 e uma divergência entre

Arief Makmur 15:00 2025-04-14 UTC+2

Previsão para o GBP/USD em 14 de abril de 2025

Na tabela horária, o par GBP/USD continuou seu movimento ascendente na sexta-feira e hoje está a caminho de atingir o nível 1,3151. Um salto a partir deste nível favorecerá

Samir Klishi 14:41 2025-04-14 UTC+2

Previsão para o EUR/USD em 14 de abril de 2025

Na sexta-feira, o par EUR/USD continuou a subir, mas recuou na segunda metade do dia. O declínio (ou seja, o fortalecimento do dólar) foi de curta duração e, no final

Samir Klishi 14:34 2025-04-14 UTC+2

Sinais de negociação para o EUR/USD para 11-15 de abril de 2025: venda abaixo de 1,1470 (+2/8 de Murray - sobrecompra)

Durante a sessão europeia, o euro atingiu uma nova alta em torno do nível +2/8 de Murray, localizado em 1,1473. Esse movimento no EUR/USD ocorreu após o anúncio do Ministério

Dimitrios Zappas 18:09 2025-04-11 UTC+2

Sinais de negociação para o OURO (XAU/USD) para 11-13 de abril de 2025: venda abaixo de $3.235 (+1/8 de Murray - sobrecompra)

No início da sessão americana, o ouro está passando por uma forte correção técnica depois de atingir uma nova alta em torno de 3.237,69 por enquanto. Os dados econômicos

Dimitrios Zappas 18:07 2025-04-11 UTC+2

Previsão para o EUR/USD para 11 de abril de 2025

Nas últimas 24 horas e na manhã de hoje, o euro atingiu o intervalo-alvo entre 1,1385 e 1,1420, correspondente às máximas registradas em junho de 2019 e 2020. A linha

Laurie Bailey 17:25 2025-04-11 UTC+2

Previsão para o GBP/USD para 11 de abril de 2025

A libra esterlina alcançou o nível-alvo de 1,3001. A linha de sinal do oscilador Marlin está cruzando a linha zero para o território positivo, o que abre caminho para

Laurie Bailey 17:20 2025-04-11 UTC+2

EUR/USD – 11 de abril. A queda do dólar não mostra sinais de que vai parar

Na quinta-feira, o par EUR/USD permaneceu em tendência de alta ao longo do dia, acumulando um ganho de 400 pontos e aproximando-se do nível de 261,8% na retração de Fibonacci

Samir Klishi 15:40 2025-04-11 UTC+2
Não pode falar agora?
Faça sua pergunta no chat.
Widget callback
 

Dear visitor,

Your IP address shows that you are currently located in the USA. If you are a resident of the United States, you are prohibited from using the services of InstaFintech Group including online trading, online transfers, deposit/withdrawal of funds, etc.

If you think you are seeing this message by mistake and your location is not the US, kindly proceed to the website. Otherwise, you must leave the website in order to comply with government restrictions.

Why does your IP address show your location as the USA?

  • - you are using a VPN provided by a hosting company based in the United States;
  • - your IP does not have proper WHOIS records;
  • - an error occurred in the WHOIS geolocation database.

Please confirm whether you are a US resident or not by clicking the relevant button below. If you choose the wrong option, being a US resident, you will not be able to open an account with InstaForex anyway.

We are sorry for any inconvenience caused by this message.