اصل پیٹرن یعنی ایکچوئل پیٹرن
پیٹرن تصویری صورت یعنی گرافکل ماڈلز ہوتے ہیں جو کہ چارٹ میں قیمت کی جانب سے بنتے ہیں جو کہ ٹیکنیکل تجزیات کے امکانات ، ہسٹری {قیمت کے اتار چڑھاو} چونکہ قیمت اپنے آپ کو دہراتی ہے - جس کا مطلب یہ ہے کہ قیمت کا اتار چڑھا یعنی حرکت ایک جیسے حالات میں ہی عموما مختلف ہوتی ہے جو کہ اس بات کو ممکن بناتی ہے قیمت کے مزید رویہ کی پیشن گوئی کی جاسکے جس کا اُسی طرح ہونے کے امکانات خاصے واضح ہوتے ہیں
Actual Patterns
- All
- Double Top
- Flag
- Head and Shoulders
- Pennant
- Rectangle
- Triangle
- Triple top
- All
- #AAPL
- #AMZN
- #Bitcoin
- #EBAY
- #FB
- #GOOG
- #INTC
- #KO
- #MA
- #MCD
- #MSFT
- #NTDOY
- #PEP
- #TSLA
- #TWTR
- AUDCAD
- AUDCHF
- AUDJPY
- AUDUSD
- EURCAD
- EURCHF
- EURGBP
- EURJPY
- EURNZD
- EURRUB
- EURUSD
- GBPAUD
- GBPCHF
- GBPJPY
- GBPUSD
- GOLD
- NZDCAD
- NZDCHF
- NZDJPY
- NZDUSD
- SILVER
- USDCAD
- USDCHF
- USDJPY
- USDRUB
- All
- M5
- M15
- M30
- H1
- D1
- All
- Buy
- Sale
- All
- 1
- 2
- 3
- 4
- 5
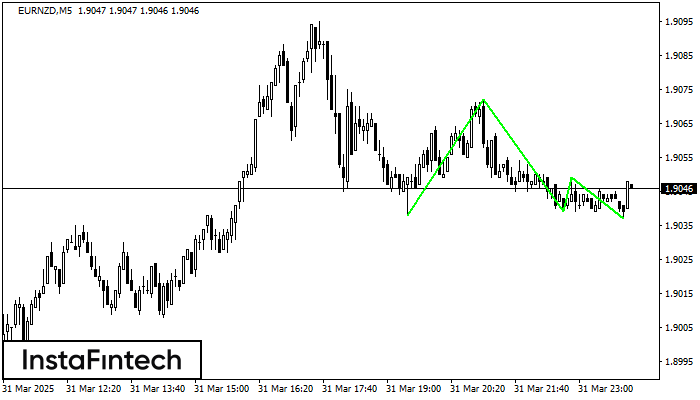
The Triple Bottom pattern has been formed on EURNZD M5. It has the following characteristics: resistance level 1.9072/1.9049; support level 1.9038/1.9037; the width is 34 points. In the event
The M5 and M15 time frames may have more false entry points.
Open chart in a new window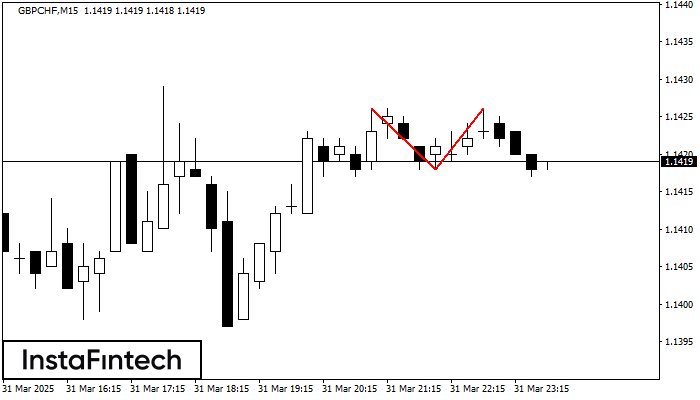
The Double Top reversal pattern has been formed on GBPCHF M15. Characteristics: the upper boundary 1.1426; the lower boundary 1.1418; the width of the pattern is 8 points. Sell trades
The M5 and M15 time frames may have more false entry points.
Open chart in a new window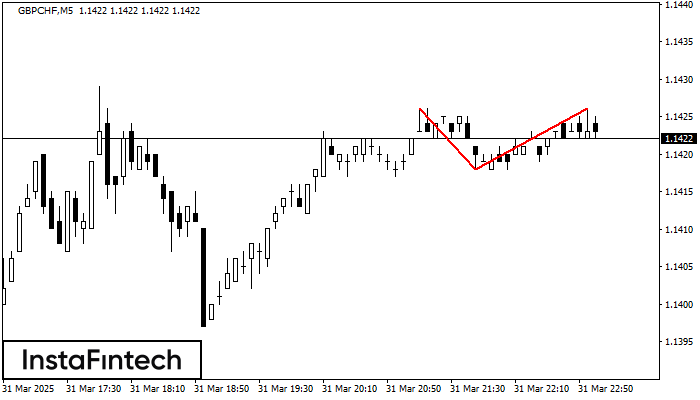
The Double Top pattern has been formed on GBPCHF M5. It signals that the trend has been changed from upwards to downwards. Probably, if the base of the pattern 1.1418
The M5 and M15 time frames may have more false entry points.
Open chart in a new window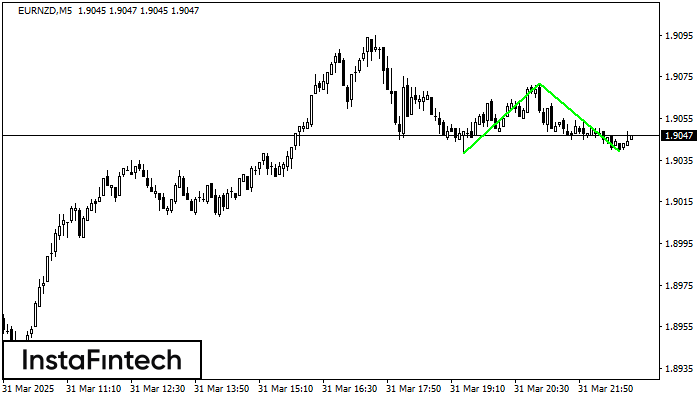
The Double Bottom pattern has been formed on EURNZD M5; the upper boundary is 1.9072; the lower boundary is 1.9039. The width of the pattern is 34 points. In case
The M5 and M15 time frames may have more false entry points.
Open chart in a new window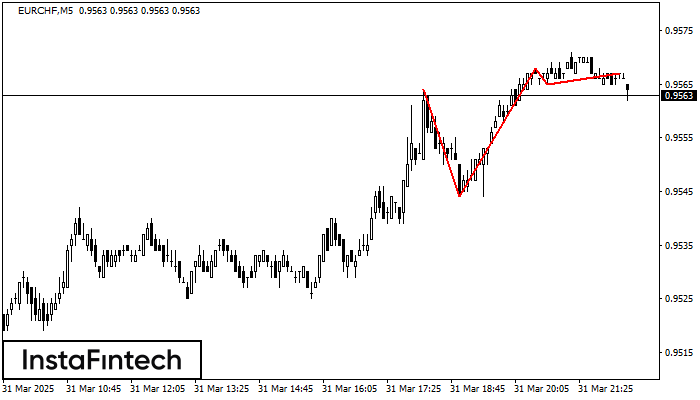
The Triple Top pattern has formed on the chart of the EURCHF M5 trading instrument. It is a reversal pattern featuring the following characteristics: resistance level -3, support level -21
The M5 and M15 time frames may have more false entry points.
Open chart in a new window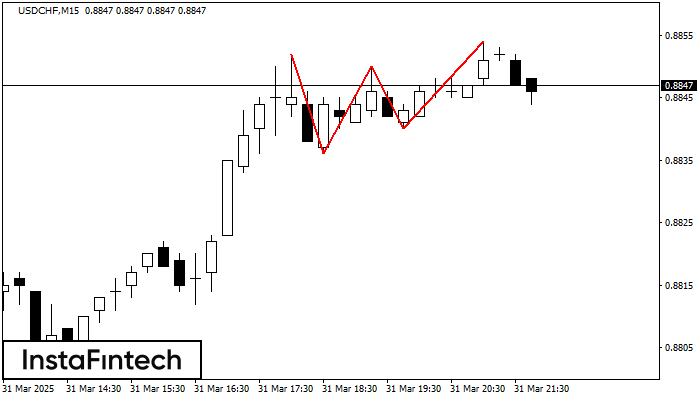
The Triple Top pattern has formed on the chart of the USDCHF M15 trading instrument. It is a reversal pattern featuring the following characteristics: resistance level -2, support level -4
The M5 and M15 time frames may have more false entry points.
Open chart in a new window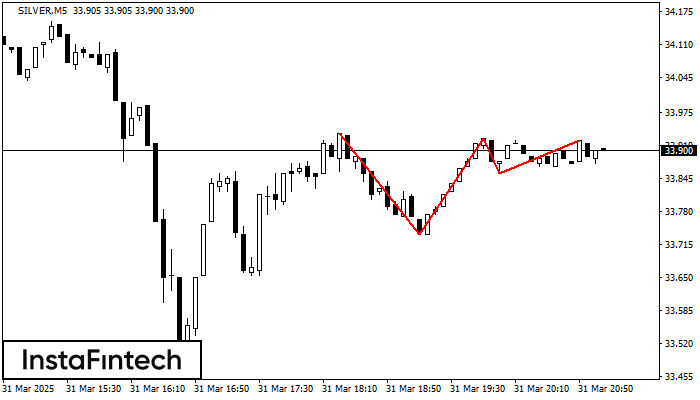
The Triple Top pattern has formed on the chart of the SILVER M5 trading instrument. It is a reversal pattern featuring the following characteristics: resistance level 15, support level -120
The M5 and M15 time frames may have more false entry points.
Open chart in a new window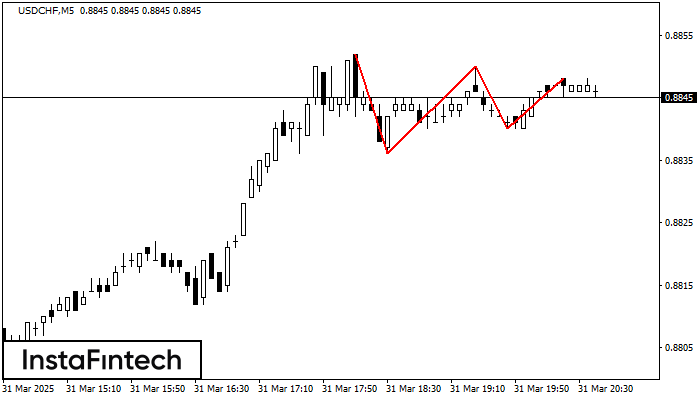
The Triple Top pattern has formed on the chart of the USDCHF M5 trading instrument. It is a reversal pattern featuring the following characteristics: resistance level 4, support level -4
The M5 and M15 time frames may have more false entry points.
Open chart in a new window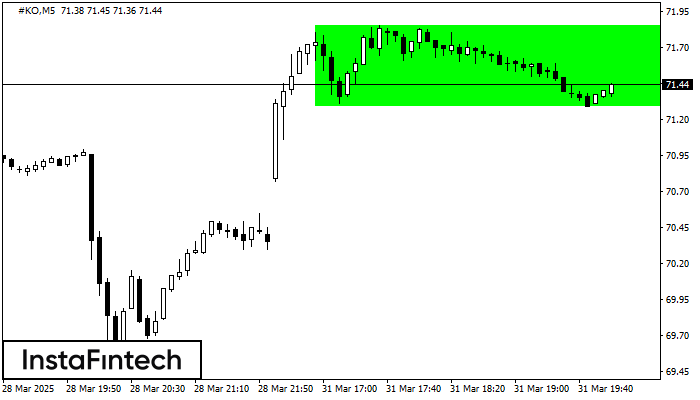
According to the chart of M5, #KO formed the Bullish Rectangle. The pattern indicates a trend continuation. The upper border is 71.85, the lower border is 71.29. The signal means
The M5 and M15 time frames may have more false entry points.
Open chart in a new window