empty
28.01.2025 01:33 PM
EUR/USD: January 28. The Market Prepares for ECB and FOMC Meetings

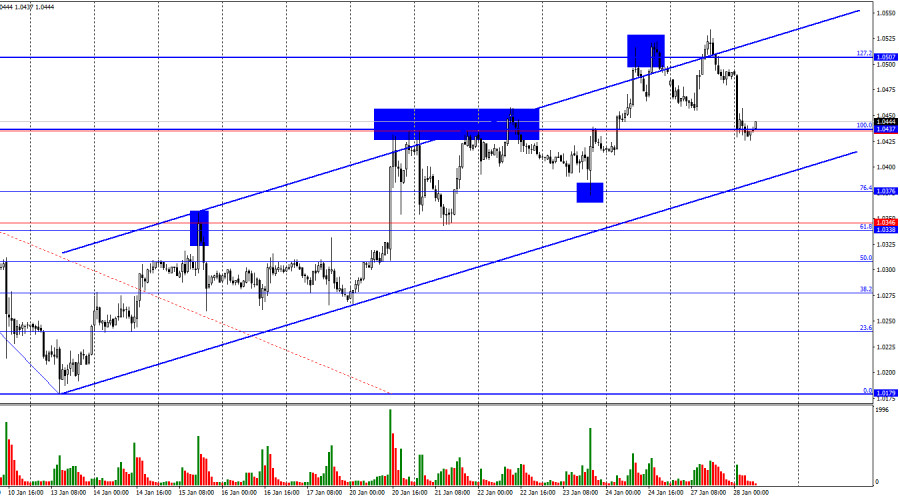
On Monday, the EUR/USD pair reversed near the 127.2% corrective level at 1.0507 in favor of the US dollar and fell toward the 100.0% corrective level at 1.0437. A rebound from this level could signal a reversal in favor of the euro and a renewed rise within the upward channel toward the 1.0507 level. Conversely, a consolidation below 1.0437 would increase the likelihood of continued decline.

This image is no longer relevant

The wave structure remains clear. The last completed downward wave broke the low of the previous wave, while the most recent (still incomplete) upward wave has broken through the last two peaks. This indicates that the bearish trend is considered completed. In the near term, a new downward wave may begin to form, but for the bears to initiate a new trend, they must push the pair back toward the 1.0179 level. Alternatively, they could form a more complex wave structure to regain control.

On Monday, the economic news flow was nearly absent. ECB President Christine Lagarde delivered a new speech, but she focused more on the independence of central banks rather than on monetary policy or interest rates. As a result, her remarks failed to provoke a reaction from traders—and likely weren't intended to. Meanwhile, traders are already in a wait-and-see mode ahead of two major central bank meetings. Tomorrow evening, the results of the FOMC meeting will be announced, followed by the ECB meeting on Thursday. In my opinion, both events could support bearish traders, though it is impossible to predict this with certainty. If the market senses a dovish shift in Jerome Powell's rhetoric, it could be detrimental to the US dollar. While I don't believe the dollar will remain under pressure throughout 2025, the market is currently anticipating a maximum of two rate cuts. Should Powell indicate the possibility of more substantial cuts, this could cause significant disappointment among dollar bulls. Graphically, the dollar may see strong growth if the pair closes below the ascending channel.

This image is no longer relevant

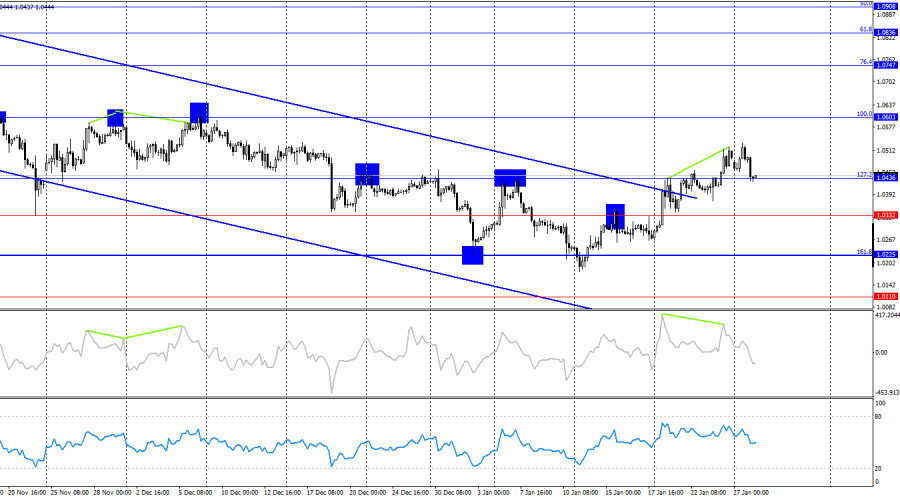
On the 4-hour chart, the pair consolidated above the 127.2% corrective level at 1.0436. This suggests that the upward movement may continue toward the next Fibonacci level of 100.0% at 1.0603. The euro has also broken out of the downward trend channel. While the trend is gradually shifting to bullish, it remains uncertain how long this trend will last. A bearish divergence in the CCI indicator suggests a potential decline in the near term, but the bears have yet to achieve a close below 1.0436.

Commitments of Traders (COT) Report

This image is no longer relevant

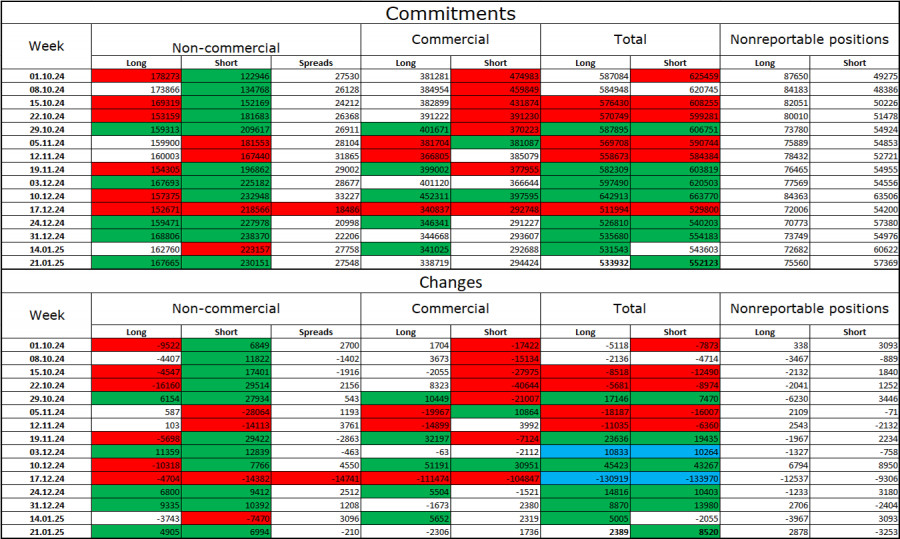
During the last reporting week, professional traders opened 4,905 long positions and 6,994 short positions. The sentiment of the Non-commercial group remains bearish, suggesting the potential for further declines in the pair. The total number of long positions held by speculators now stands at 167,000, compared to 230,000 short positions.

For eighteen consecutive weeks, major players have been selling the euro, indicating a bearish trend without exceptions. Occasionally, bulls dominate during specific weeks, but these instances are more of an anomaly. The primary driver of dollar weakness—the market's expectation of dovish FOMC policy—has already been priced in. While new reasons to sell the dollar could emerge over time, the likelihood of its recovery remains higher. Chart analysis also supports the continuation of the long-term bearish trend. As a result, I expect the EUR/USD pair to continue its decline.

News Calendar for the US and Eurozone:

  • US: Durable Goods Orders (13:30 UTC).
  • Eurozone: ECB President Christine Lagarde Speech (17:00 UTC).

On January 28, the economic calendar includes another Lagarde speech and a key US report. The overall impact of the news on market sentiment today is expected to be moderate.

EUR/USD Forecast and Recommendations:

  • Sell Opportunities: Consider selling the pair after a consolidation below the upward trend channel on the hourly chart. The likelihood of a long-term trend shift to bullish remains high.
  • Buy Opportunities: Buying is possible today on a rebound from the 1.0437 level on the hourly chart, with a target of 1.0507.

Fibonacci Levels:

  • Hourly Chart: 1.0437–1.0179.
  • 4-Hour Chart: 1.0603–1.1214.
Pilih carta masa
5
min
15
min
30
min
1
jam
4
jam
1
hari
1
minggu
Jana pendapatan melalui perubahan kadar mata wang kripto dengan InstaForex.
Muat turun MetaTrader 4 dan buka dagangan pertama anda.
  • Grand Choice
    Contest by
    InstaForex
    InstaForex always strives to help you
    fulfill your biggest dreams.
    SERTAI PERADUAN

Artikel yang dicadangkan

Ramalan untuk GBP/USD pada 18 Februari 2025

Pada carta setiap jam, pasangan GBP/USD mengundur ke zon rintangan 1.2611–1.2620 pada hari Isnin tetapi sekali lagi gagal untuk ditutup di atasnya. Pemulihan yang disahkan dari zon ini akan memihak

Samir Klishi 11:28 2025-02-18 UTC+2

Analisis Teknikal Pergerakan Harga Harian bagi Pasangan Mata Wang Utama EUR/USD, Selasa 18 Februari 2025.

Pada carta 4 jam, pasangan mata wang utama EUR/USD menunjukkan terdapat Perbezaan antara pergerakan harga Fiber dan penunjuk MACD Histogram (12,26,9). Ini mengesahkan bahawa dalam masa terdekat, EUR/USD berpotensi untuk

Arief Makmur 07:17 2025-02-18 UTC+2

Analisis Teknikal Pergerakan Harga Intraday Instrumen Komoditi XPD/USD, Selasa 18 Februari 2025

Dengan keadaan penunjuk Pengayun Stochastic yang masih menunjukkan JUAL Bersilang (Crossing SELL) dan disahkan oleh pergerakan harga XPD/USD yang berada di bawah EMA 21, ini menunjukkan bahawa dalam masa terdekat

Arief Makmur 07:17 2025-02-18 UTC+2

Ramalan EUR/USD untuk 18 Februari 2025

Dalam dua sesi terakhir, euro telah membuat penyatuan di atas paras 1.0458, menunjukkan tanda-tanda perbezaan dengan pengayun Marlin. Corak ini menonjolkan dua ciri utama pasaran: harga sedang bergelut untuk mengekalkan

Laurie Bailey 04:46 2025-02-18 UTC+2

Ramalan GBP/USD untuk 18 Februari, 2025

Pound British telah membuat pembetulan sebanyak 38.2% daripada keseluruhan pergerakan sejak 26 Ogos tahun lalu, mencapai paras sasaran pada 1.2616. Pengayun Marlin pada carta harian menunjukkan penurunan, yang menandakan kemungkinan

Laurie Bailey 04:46 2025-02-18 UTC+2

Ramalan USD/JPY bagi 18 Februari 2025

Pasangan mata wang USD/JPY telah mencapai tahap sokongan pada 151.30 dan mula bergerak naik dari titik ini. Pengayun Marlin menunjukkan aliran kenaikan, memberikan tanda-tanda untuk membuat percubaan baru mencapai garis

Laurie Bailey 04:46 2025-02-18 UTC+2

Isyarat Dagangan untuk EUR/USD bagi 17-19 Februari 2025: jual di bawah 1.0500 (21 SMA - 6/8 Murray)

Jika EUR/USD mengukuh di atas 1.0498, ia boleh meneruskan pergerakan menaiknya dan mencapai puncak saluran aliran menaik sekitar 1.0535. Sekiranya EUR/USD melepasi zon ini, ia boleh dengan cepat mencapai 7/8

Dimitrios Zappas 15:49 2025-02-17 UTC+2

Isyarat Dagangan BITCOIN (BTC/USD) untuk 17-19 Februari 2025: beli melebihi $97,000 (SMA 21 - EMA 200)

Pengukuhan di atas 97,500 boleh menyokong pemulihan Bitcoin. Kita boleh menjangkakan ia mencapai EMA 200 yang terletak sekitar 98,591 dan akhirnya menguji tahap psikologi $100,000 dan mungkin mencapai 5/8 Murray

Dimitrios Zappas 15:47 2025-02-17 UTC+2

Analisis Teknikal Pergerakan Harga Harian bagi Pasangan Mata Wang Silang CAD/JPY, Isnin 17 Februari 2025.

Dengan kemunculan corak Bullish Divergence, nampaknya CAD/JPY pada carta 30-minit mempunyai potensi untuk mengukuh selagi tidak ada penurunan lanjut yang menembusi dan menutup di bawah tahap106.86. Dalam keadaan ini, CAD/JPY

Arief Makmur 08:18 2025-02-17 UTC+2

Analisis Teknikal Pergerakan Harga harian pada Pasangan Mata Wang Silang GBP/CHF, Isnin 17 Februari 2025.

Dari pengamatan kami pada carta 4 jam, pasangan mata wang silang GBP/CHF kelihatan bergerak dalam saluran Pitchfork bullish, yang disahkan terutamanya oleh kemunculan corak Bullish 123 diikuti oleh Ross Hook

Arief Makmur 08:18 2025-02-17 UTC+2
Tidak boleh bertanya sekarang?
Tanya soalan anda di Ruangan bersembang.
Panggilan semula Widget
 

Dear visitor,

Your IP address shows that you are currently located in the USA. If you are a resident of the United States, you are prohibited from using the services of InstaFintech Group including online trading, online transfers, deposit/withdrawal of funds, etc.

If you think you are seeing this message by mistake and your location is not the US, kindly proceed to the website. Otherwise, you must leave the website in order to comply with government restrictions.

Why does your IP address show your location as the USA?

  • - you are using a VPN provided by a hosting company based in the United States;
  • - your IP does not have proper WHOIS records;
  • - an error occurred in the WHOIS geolocation database.

Please confirm whether you are a US resident or not by clicking the relevant button below. If you choose the wrong option, being a US resident, you will not be able to open an account with InstaForex anyway.

We are sorry for any inconvenience caused by this message.