GBP/USD 5-Minute Analysis
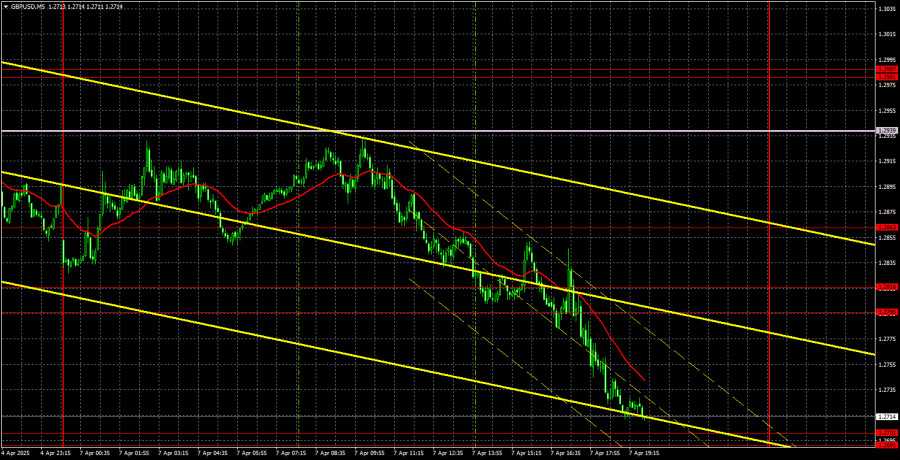
The GBP/USD currency pair continued its downward movement on Monday. Explaining this is extremely difficult, even in hindsight—especially since the euro experienced growth on the same day or was at least rising throughout the session. Despite showing remarkable resilience against the dollar for months, the British pound has fallen sharply for the second consecutive day. Perhaps the market has finally realized that the pound is overbought and that Donald Trump's tariffs will hurt not only the U.S. economy. But how could anyone have predicted such a shift in market sentiment?
We've often said that virtually any movement can be explained after the fact. However, when it comes to predicting movements, the problems increase significantly. One can always tell that the market has experienced a shift in sentiment or that risk-on/risk-off sentiment has changed. But how do you profit from that? Last week, Donald Trump imposed tariffs on all U.S. imports, and this week, he's already considering suspending them for 90 days. At the same time, Fed Chair Jerome Powell stated that the Fed won't cut rates just because Trump wants it—but then announced an emergency closed-door meeting on Monday. News is coming in by the hour—how can anyone keep up? Even major market players change sentiment five times a day, which is reflected in the charts. Moreover, each trading session has different participants with their moods and views of the situation.
If the pound was trading relatively technically on Friday, on Monday, it ignored all technical levels. As such, we chose not to mark trading signals on the illustrations. We believe that in such market conditions, the likelihood of significant losses or drawdowns is much higher than the chance of profit.
COT Report
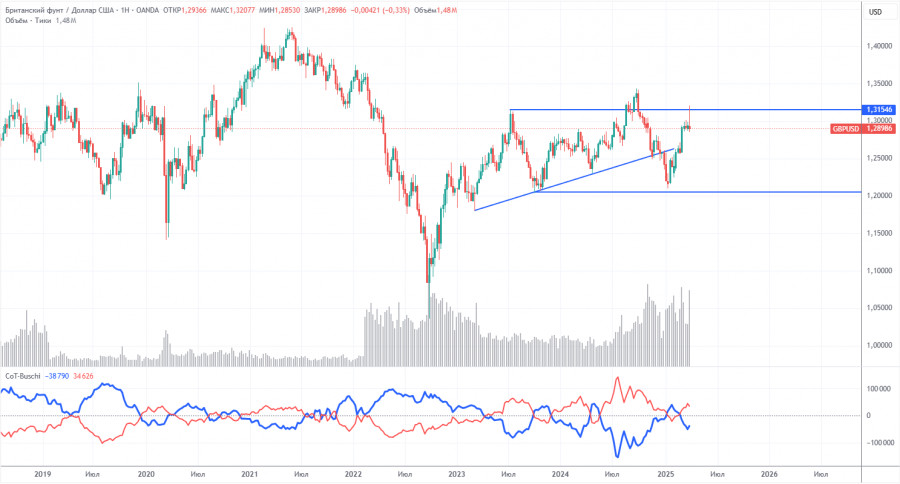
COT reports for the British pound show that sentiment among commercial traders has been constantly shifting in recent years. The red and blue lines, which represent the net positions of commercial and non-commercial traders, frequently cross and mostly hover around the zero line. At present, they remain close together, indicating a relatively balanced number of long and short positions.
On the weekly timeframe, the price first broke through the 1.3154 level, then overcame the trend line, returned to 1.3154, and bounced off it. Breaking the trend line suggests a high probability that the pound's decline will continue. The bounce from 1.3154 increases the likelihood of this scenario. Once again, the weekly chart looks as though the pound is preparing to move south.
According to the latest report on the British pound, the "Non-commercial" group closed 4,000 long contracts and opened 5,600 short contracts. As a result, the net position of non-commercial traders fell by 9,600 contracts.
The fundamental backdrop still provides no basis for long-term buying of the British pound, and the currency itself still has real potential to continue the global downtrend. The recent rally in the pound was driven by one factor alone — Donald Trump's policy.
GBP/USD 1-Hour Analysis
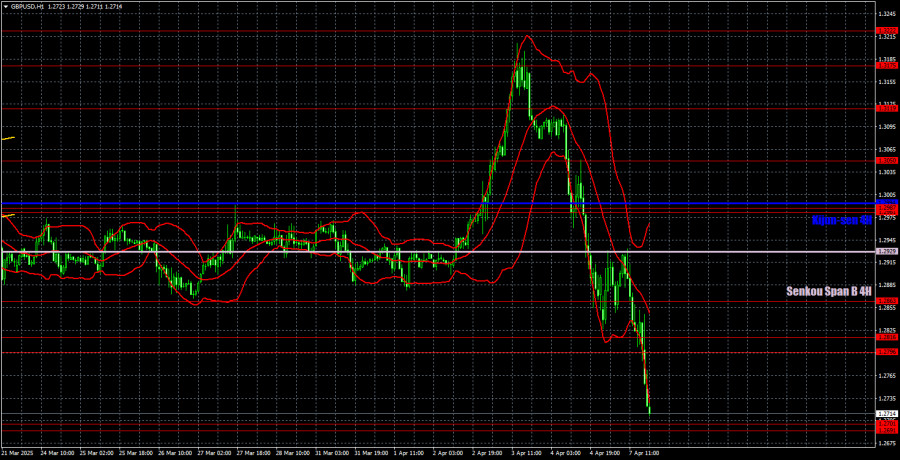
In the hourly time frame, the GBP/USD pair saw a massive surge followed by an even sharper collapse after nearly a month of sideways movement. Despite the pound's three-month-long growth, it had little to do with its strength. The entire rally was driven by dollar weakness, sparked by Donald Trump's actions. And the most interesting part is that this upward movement could end at any moment, no matter how stable it may seem. Everything Trump has done in recent months has only further confused the technical picture across all timeframes. Currently, the British pound is declining sharply, which is just as challenging to explain from a fundamental or macroeconomic viewpoint. But we wouldn't be surprised if the drop ends tomorrow and the dollar starts to fall again.
For April 8, we highlight the following important levels: 1.2511, 1.2605–1.2620, 1.2691–1.2701, 1.2796–1.2816, 1.2863, 1.2981–1.2987, 1.3050, 1.3119, 1.3175, 1.3222, 1.3273, 1.3358. The Senkou Span B line (1.2929) and the Kijun-sen line (1.2994) can also serve as sources of signals. Moving Stop Loss to breakeven once the price moves 20 pips in the right direction is recommended. Note that the Ichimoku indicator lines may shift during the day, which should be considered when identifying trading signals.
No significant events are scheduled in the U.S. or the UK on Tuesday, but it's important to understand that the global trade war is gaining momentum. Every day, we may receive new information about tariffs and sanctions worldwide. This news can impact exchange rates in various ways, but predicting how it will do so is impossible. Monday showed us exactly what kind of mood the market is in.
Illustration Explanations:
- Support and Resistance Levels (thick red lines): Thick red lines indicate where movement may come to an end. Please note that these lines are not sources of trading signals.
- Kijun-sen and Senkou Span B Lines: Ichimoku indicator lines transferred from the 4-hour timeframe to the hourly timeframe. These are strong lines.
- Extreme Levels (thin red lines): Thin red lines where the price has previously bounced. These serve as sources of trading signals.
- Yellow Lines: Trendlines, trend channels, or any other technical patterns.
- Indicator 1 on COT Charts: Represents the net position size for each category of traders.


