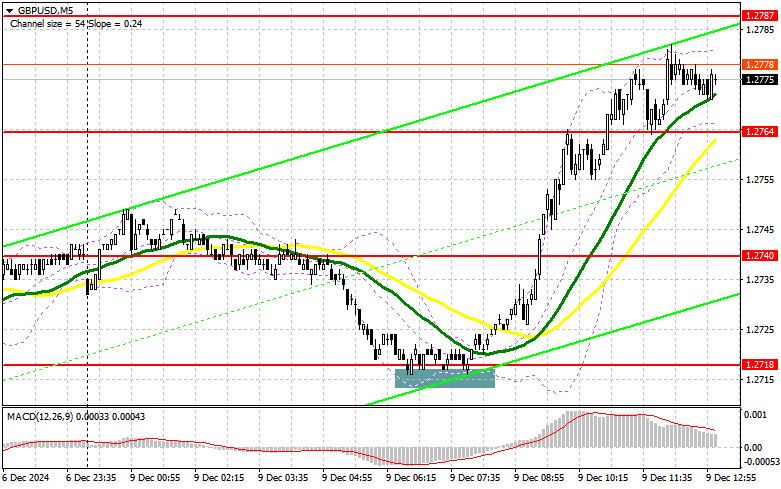
In my morning forecast, I focused on the 1.2718 level and planned to base market entry decisions on it. Let's analyze the 5-minute chart to see what happened. A decline and a false breakout at this level provided a good entry point for buying, resulting in the pair's rise by more than 50 points. The technical picture for the second half of the day has been revised.
To Open Long Positions on GBP/USD:
Pound buyers seized the opportunity presented by attractive prices during the Asian correction and are now likely targeting last week's highs. With no significant U.S. statistics other than wholesale inventory data, the focus will likely shift to a speech by the Bank of England's Deputy Governor for Markets and Banking, Sir David Ramsden. If his comments include specific details about future policy, the pound may react with a decline. Otherwise, the GBP/USD pair could continue rising.
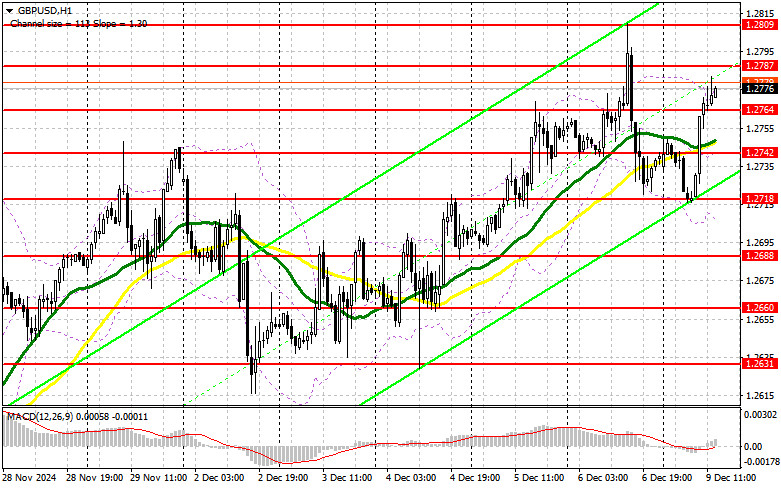
In the current scenario, where the pound has already grown significantly, the best strategy is to act on pullbacks. Active defense by buyers of the new 1.2754 support level would provide a good entry point, aiming for a recovery toward the 1.2787 resistance. A breakout and retest of this level from top to bottom would create a new buying opportunity, targeting 1.2809. The ultimate target is the 1.2827 level, where I plan to lock in profits.
If GBP/USD declines and there is no bullish activity around 1.2764, the buyers' momentum may not be entirely lost, but the pair will likely remain in a sideways channel by the end of the day. A false breakout at 1.2742 would be a suitable condition for opening long positions. I plan to buy GBP/USD immediately on a bounce from the 1.2718 low, targeting an intraday correction of 30–35 points.
To Open Short Positions on GBP/USD:
Pressure on the pound could resume if buyers show weak activity around last week's high. For this reason, I prefer to consider selling at the nearest resistance of 1.2787, where a false breakout would provide a good entry point, targeting a drop to the 1.2764 support level. A breakout and retest of this range from below would trigger stop-loss orders, opening the way to 1.2742, where the moving averages favoring bulls are located. The ultimate target for short positions is 1.2718, where profits should be locked in.
If pound demand persists after the Bank of England official's speech and GBP/USD rises without significant bearish activity around 1.2787, buyers will gain a strong opportunity to further develop the bullish market. Bears will likely retreat to the 1.2809 resistance, where I will sell only after a false breakout. If there is no downward movement there, I will consider short positions on a rebound from 1.2827, aiming for an intraday correction of 30–35 points.
COT Report (Commitments of Traders):
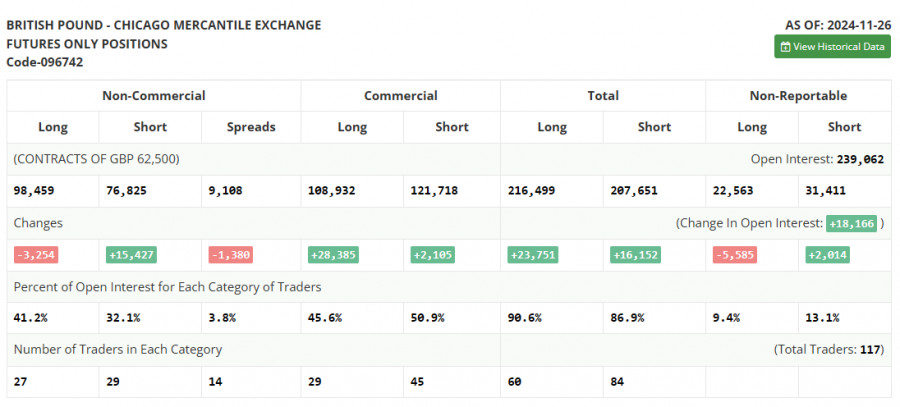
The COT report for November 26 showed a decrease in long positions and a sharp increase in short ones. The Bank of England's reluctance to lower interest rates further currently works against pound buyers. Normally, such policy decisions would strengthen the national currency, but weak economic indicators are pushing the UK closer to a potential recession next year. Rising inflation and anticipated U.S. tariffs are also weighing on traders' and investors' confidence.
According to the COT report, non-commercial long positions decreased by 3,254 to 98,459, while short positions increased by 15,427 to 76,825, narrowing the gap between long positions and short positions by 1,380.
Indicator Signals:
Moving Averages:Trading is above the 30- and 50-day moving averages, indicating the potential for further pair growth.
- 30-period SMA (green) and 50-period SMA (yellow) on the hourly chart are key trend indicators.
Bollinger Bands:The lower boundary of the Bollinger Bands around 1.2715 serves as support in case of a decline.
Key Indicator Definitions:
- Moving Average (SMA): Smoothens volatility and noise to identify trends.
- MACD Indicator: Tracks the convergence/divergence of moving averages for trend signals.
- Bollinger Bands: Identifies potential support/resistance and measures volatility.
- Non-commercial traders: Speculators, such as hedge funds and institutions, using futures markets for profit.
- Long/short positions: Represent the cumulative bullish or bearish speculative trades.


