empty
 
 
09.12.2024 08:19 AM
EUR/USD and GBP/USD Analysis for December 9 – Technical Outlook

EUR/USD

This image is no longer relevant

Higher Timeframes

At the end of last week, the bulls managed to extend a long upper shadow on the weekly candle up to the 1.0635 area. Here, two strong resistances converge the daily mid-term trend and the weekly short-term trend. The 1.0635 level and subsequent resistances (1.0670, 1.0685, 1.0707, 1.0729, and 1.0776) form a broad resistance zone. Any of these levels could trigger a rebound, halting the bulls' advance at this stage.

Currently, the pair is influenced by the daily levels (1.0565 – 1.0545), with the monthly mid-term trend support located slightly below 1.0504. For the bears, consolidating below 1.0565–1.0504 is a primary task, while updating the minimum extremum (1.0334) and breaking the monthly Ichimoku golden cross (1.0321) would open new bearish opportunities.

This image is no longer relevant

H4 – H1

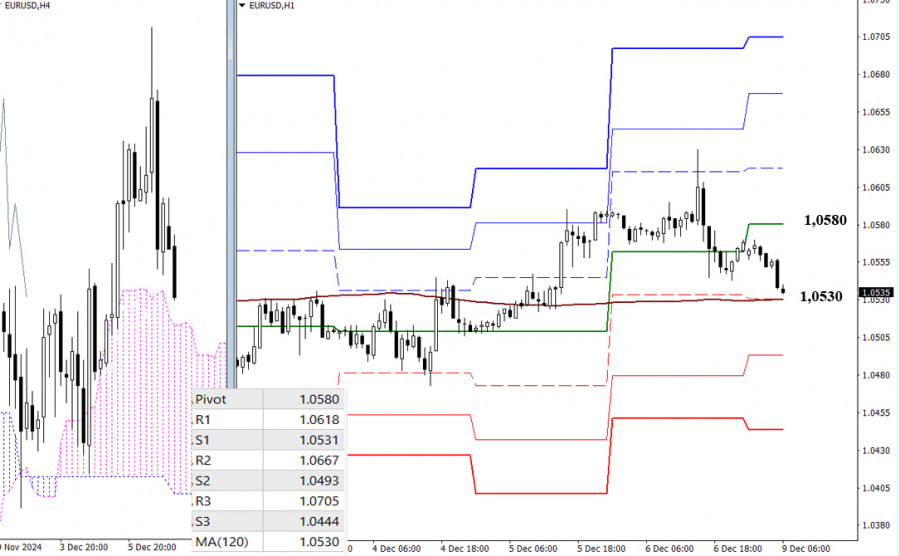
The bulls lost their advantage in lower timeframes and retreated toward the weekly long-term trend (1.0530). This area is pivotal as control of the weekly trend dictates the prevailing sentiment. A breach below 1.0530 could amplify bearish sentiment, with intraday targets at 1.0493 and 1.0444 (classic Pivot support levels). A rebound from 1.0530 and the bulls' recovery would shift focus back to resistance levels at 1.0580, 1.0618, 1.0667, and 1.0705 (classic Pivot levels).

***

GBP/USD

This image is no longer relevant

Higher Timeframes

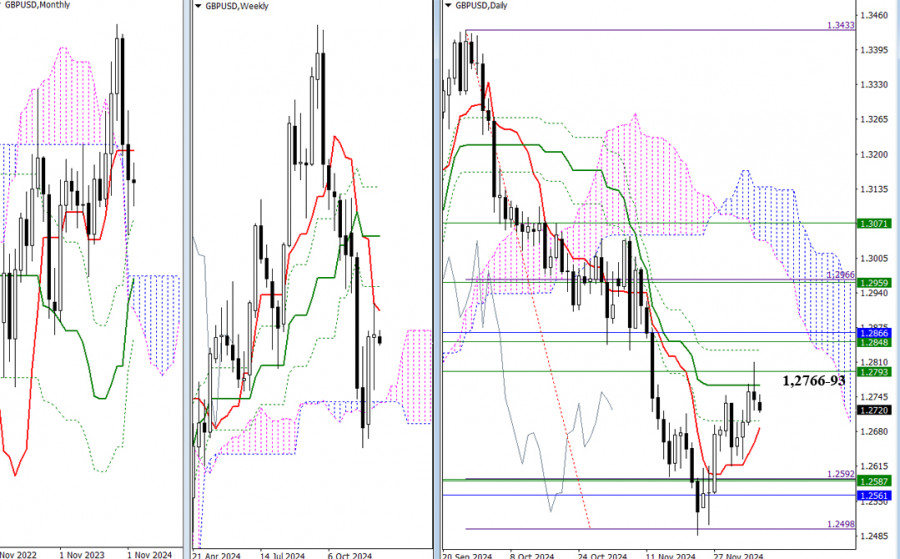
Last week's trading resulted in a corrective rise to the daily mid-term trend (1.2766) and the weekly short-term trend (1.2793). The bulls' task is to break through these resistances to continue the upward correction. The next targets lie near 1.2832-1.2848-1.2866 (the final level of the daily Ichimoku cross, weekly Fib Kijun, and monthly short-term trend).

For the bears to regain control, they need to trigger a rebound from the encountered resistances (1.2766-1.2793) and reclaim the daily short-term trend support at 1.2687. Continuation of the downtrend would then require overcoming a cluster of supports at 1.2561-1.2587 and updating the minimum extremum (1.2486), restoring the bearish trend on both daily and weekly charts.

This image is no longer relevant

H4 – H1

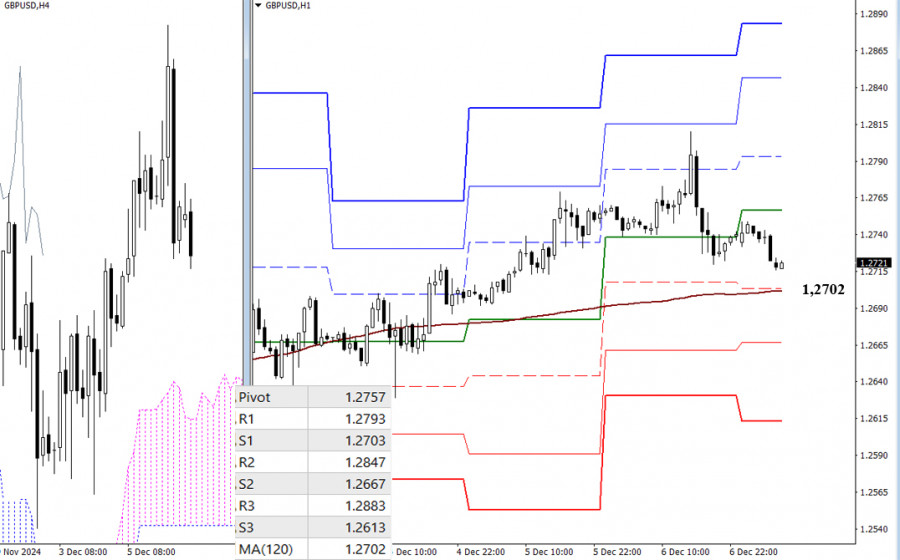
On lower timeframes, the pair has undergone a deep pullback toward the weekly long-term trend (1.2702), which defines the current balance of power. Trading above 1.2702 favors the bulls, while a move below it will strengthen bearish sentiment. The classic Pivot levels provide intraday directional cues. Bears will target supports at 1.2667 and 1.2613 if the price declines further. Conversely, if the bulls regain momentum, they aim for resistance at 1.2757, 1.2793, 1.2847, and 1.2883.

***

Technical Analysis Tools Used

  • Higher Timeframes: Ichimoku Kinko Hyo (9.26.52) + Fibo Kijun levels.
  • Lower Timeframes (H1): Classic Pivot Points + Moving Average 120 (weekly long-term trend).
Evangelos Poulakis,
Analytical expert of InstaForex
© 2007-2024
Earn on cryptocurrency rate changes with InstaForex
Download MetaTrader 4 and open your first trade
  • Grand Choice
    Contest by
    InstaForex
    InstaForex always strives to help you
    fulfill your biggest dreams.
    JOIN CONTEST
  • Chancy Deposit
    Deposit your account with $3,000 and get $6000 more!
    In December we raffle $6000 within the Chancy Deposit campaign!
    Get a chance to win by depositing $3,000 to a trading account. Having fulfilled this condition, you become a campaign participant.
    JOIN CONTEST
  • Trade Wise, Win Device
    Top up your account with at least $500, sign up for the contest, and get a chance to win mobile devices.
    JOIN CONTEST
  • 100% Bonus
    Your unique opportunity to get a 100% bonus on your deposit
    GET BONUS
  • 55% Bonus
    Apply for a 55% bonus on your every deposit
    GET BONUS
  • 30% Bonus
    Receive a 30% bonus every time you top up your account
    GET BONUS

Recommended Stories

Can't speak right now?
Ask your question in the chat.
Widget callback