empty
28.03.2023 12:48 AM
Technical analysis of EUR/USD for March 28, 2023

This image is no longer relevant

Overview :

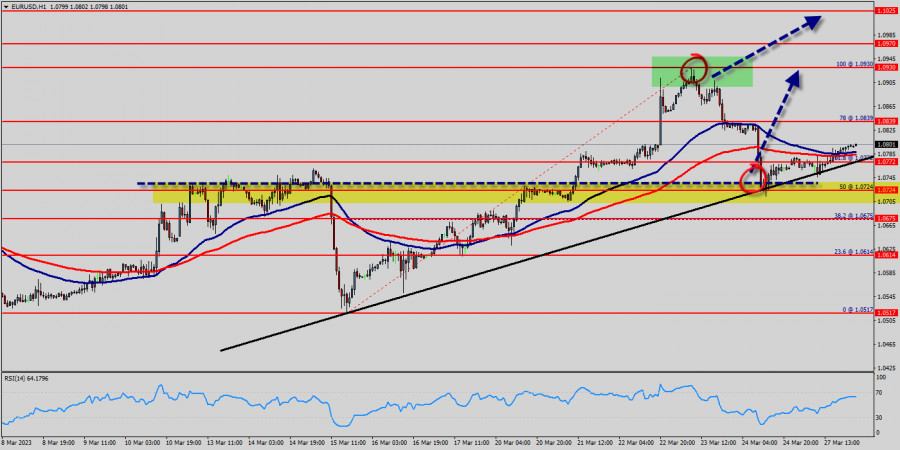
Euro parity still in play ahead of decisive US inflation data, for that common currency came within whisker of 1.0830 this week. Right now, the EUR/USD pair is still moving around the price of 1.0703 - 1.0839. The currency pair EUR/USD is trading above the support levels of 1.0661, 1.0703 and 1.0761. The euro to US dollar (EUR/USD) rate has fallen about 1.75% year-to-date to trade around 1.0839.

The raise is comparable to gains last seen for two weeks, when the European Central Bank unleashed its massive stimulus programme. The EUR/USD pair continues to move upwards from the level of 1.0761, which represents the double bottom in the hourly chart. The pair rose from the level of 1.0703 to the top around 1.0839. Today, the first resistance level is seen at 1.0839 followed by 1.0895, while daily support is seen at the levels of 1.0761 and 1.0703.

According to the previous events, the EUR/USD pair is still trading between the levels of 1.0761 and 1.0895. Hence, we expect a range of 134 pips in coming hours (1.0895 - 1.0761). The first resistance stands at the price of 1.0761, therefore if the EUR/USD pair succeed to break through the resistance level of 1.0761, the market will rise further to 1.0895. This would suggest a bullish market because the RSI indicator is still in a positive area and does not show any trend-reversal signs. The pair is expected to climb higher towards at least 1.0947 in order to test the second resistance (1.0947).

The US Dollar and the Euro are two of the most prominent and well-known currencies in the world. The Euro versus US Dollar (EUR/USD) currency pair has the largest global trading volume, meaning it is the world's most-traded currency pair.

Whether you find the instrument easy or difficult to trade on, it's not a pair that many traders neglect, due to its daily volatility and price movement. The market is indicating a bullish opportunity above the above-mentioned support levels, for that the bullish outlook remains the same as long as the 100 EMA is headed to the upside. Today, resistance is seen at the levels of 1.0839, 1.0895 and 1.0947.

So, we expect the price to set above the strong support at the levels of 1.0761 and 1.0703; because the price is in a bullish channel now. The RSI starts signaling an upward trend. Consequently, the market is likely to show signs of a bullish trend.

Thus, it will be good to buy above the level of 1.0761 with the first target at 1.0839 and further to 1.0895 in order to test the daily resistance. If the GBP/USD pair is able to break out the daily resistance at 1.0895 , the market will rise further to 1.0947 to approach resistance 3 in coming hours or days.

However, the price spot of 1.0703 remains a significant support zone. Therefore, the trend is still bullish as long as the level of 1.0703 is not breached.

Mourad El Keddani,
الخبير التحليلي لدى شركة إنستافوركس
© 2007-2025
حدد الإطار الزمني
5
د
15
د
30
د
1
س
4
ساعات
1
يوم
1
أسبوع
كسب عائد من تغيرات أسعار العملات المشفرة مع إنستافوركس.
قم بتحميل منصة التداول ميتاتريدر 4 وافتح أول صفقة.
  • Grand Choice
    Contest by
    InstaForex
    InstaForex always strives to help you
    fulfill your biggest dreams.
    انضم إلى المسابقة

المقالات الموصى بها

الذهب: استمرار حالة عدم اليقين يدعم أسعار الذهب

تستمر أسعار الذهب في تلقي الدعم وسط ضبابية عدم اليقين المحيطة بمسار الحروب الجمركية التي بدأها دونالد ترامب. لقد ارتفعت أسعار الذهب بشكل شبه عمودي لمدة أربعة أشهر. المحرك الرئيسي

Pati Gani 11:49 2025-04-17 UTC+2

توقعات اليورو/الدولار الأمريكي ليوم 17 أبريل 2025

يوم الأربعاء، تحرك اليورو مرة أخرى إلى النطاق المستهدف بين 1.1385 و1.1420. ومع ذلك، تشير سلوكيات الأسعار الأخيرة إلى أن مستوى 1.1385 أصبح الآن غير ضروري — حيث نرى نطاقًا

Laurie Bailey 11:07 2025-04-17 UTC+2

توقعات GBP/USD ليوم 17 أبريل 2025

أصدرت المملكة المتحدة أمس بيانات التضخم لشهر مارس. انخفض مؤشر أسعار المستهلكين الأساسي من 3.0% على أساس سنوي إلى 2.8% على أساس سنوي، وتراجع مؤشر أسعار المستهلكين الرئيسي من 2.8%

Laurie Bailey 11:02 2025-04-17 UTC+2

توقعات USD/CAD ليوم 17 أبريل 2025

على الرسم البياني اليومي لزوج USD/CAD، يشير مؤشر مارلين إلى أن السعر مهيأ لاحتمال انعكاس صعودي. لا يزال المستوى المستهدف عند 1.3746 والحد الأدنى لقناة السعر، والذي يمكن اختباره نظريًا

Laurie Bailey 10:59 2025-04-17 UTC+2

توقعات الفوركس 17/04/2025: اليورو/الدولار الأمريكي، الدولار النيوزيلندي/الدولار الأمريكي، الدولار الأمريكي/الين الياباني، SP500 وبيتكوين

روابط مفيدة: مقالاتي الأخرى متوفرة في هذا القسم دورة InstaForex للمبتدئين التحليلات الشائعة افتح حساب تداول مهم: يجب على المبتدئين في تداول الفوركس أن يكونوا حذرين للغاية عند اتخاذ القرارات

Sebastian Seliga 10:59 2025-04-17 UTC+2

التحليل الفني لحركة السعر اللحظية لمؤشر ناسداك 100، الخميس 17 أبريل 2025.

من خلال ما نراه على الرسم البياني لمدة 4 ساعات لمؤشر Nasdaq 100، هناك عدة أمور مثيرة للاهتمام، وهي أولاً، حركة السعر تتحرك تحت المتوسط المتحرك (100)، ثانياً، ظهور

Arief Makmur 06:27 2025-04-17 UTC+2

إشارات التداول للذهب (XAU/USD) للفترة من 16 إلى 18 أبريل 2025: البيع تحت مستوى 3,320 دولار (تشبع شرائي - 21 SMA)

في بداية الجلسة الأمريكية، يتداول الذهب حول 3,312 مع ميل صعودي بعد كسره للمثلث المتماثل. من المرجح أن يستمر الذهب في الارتفاع في الساعات القادمة، ليصل إلى مستوى 7/8 موراي

Dimitrios Zappas 18:20 2025-04-16 UTC+2

توقعات الفوركس 16/04/2025: اليورو/الدولار الأمريكي، الجنيه الإسترليني/الدولار الأمريكي، الدولار الأمريكي/الدولار الكندي، النفط والبيتكوين

روابط مفيدة: مقالاتي الأخرى متوفرة في هذا القسم دورة InstaForex للمبتدئين التحليلات الشائعة افتح حساب تداول مهم: يجب على المبتدئين في تداول الفوركس أن يكونوا حذرين للغاية عند اتخاذ القرارات

Sebastian Seliga 09:55 2025-04-16 UTC+2

التحليل الفني لحركة السعر اللحظية لأزواج العملات السلعية USD/CAD، الأربعاء 16 أبريل 2025.

على الرسم البياني لمدة 4 ساعات، يمكن ملاحظة أن زوج العملات السلعية USD/CAD يتحرك تحت المتوسط المتحرك الأسي (100) وظهور نمط Bearish 123، بالإضافة إلى وضع مؤشر Stochastic Oscillator الذي

Arief Makmur 07:37 2025-04-16 UTC+2

التحليل الفني لحركة السعر اللحظية لأزواج العملات المتقاطعة AUD/JPY، الأربعاء 16 أبريل 2025.

مع اقتراب مؤشر ستوكاستيك من مستوى التشبع البيعي (20) على الرسم البياني لمدة 4 ساعات لزوج العملات المتقاطع AUD/JPY، فإن هناك احتمالاً في المستقبل القريب لضعف AUD/JPY إلى مستوى المنطقة

Arief Makmur 07:35 2025-04-16 UTC+2
لا تستطيع التحدث الآن؟
اطرح سؤالك في الدردشة.
Widget callback
 

Dear visitor,

Your IP address shows that you are currently located in the USA. If you are a resident of the United States, you are prohibited from using the services of InstaFintech Group including online trading, online transfers, deposit/withdrawal of funds, etc.

If you think you are seeing this message by mistake and your location is not the US, kindly proceed to the website. Otherwise, you must leave the website in order to comply with government restrictions.

Why does your IP address show your location as the USA?

  • - you are using a VPN provided by a hosting company based in the United States;
  • - your IP does not have proper WHOIS records;
  • - an error occurred in the WHOIS geolocation database.

Please confirm whether you are a US resident or not by clicking the relevant button below. If you choose the wrong option, being a US resident, you will not be able to open an account with InstaForex anyway.

We are sorry for any inconvenience caused by this message.